
Industrial park operations data wall
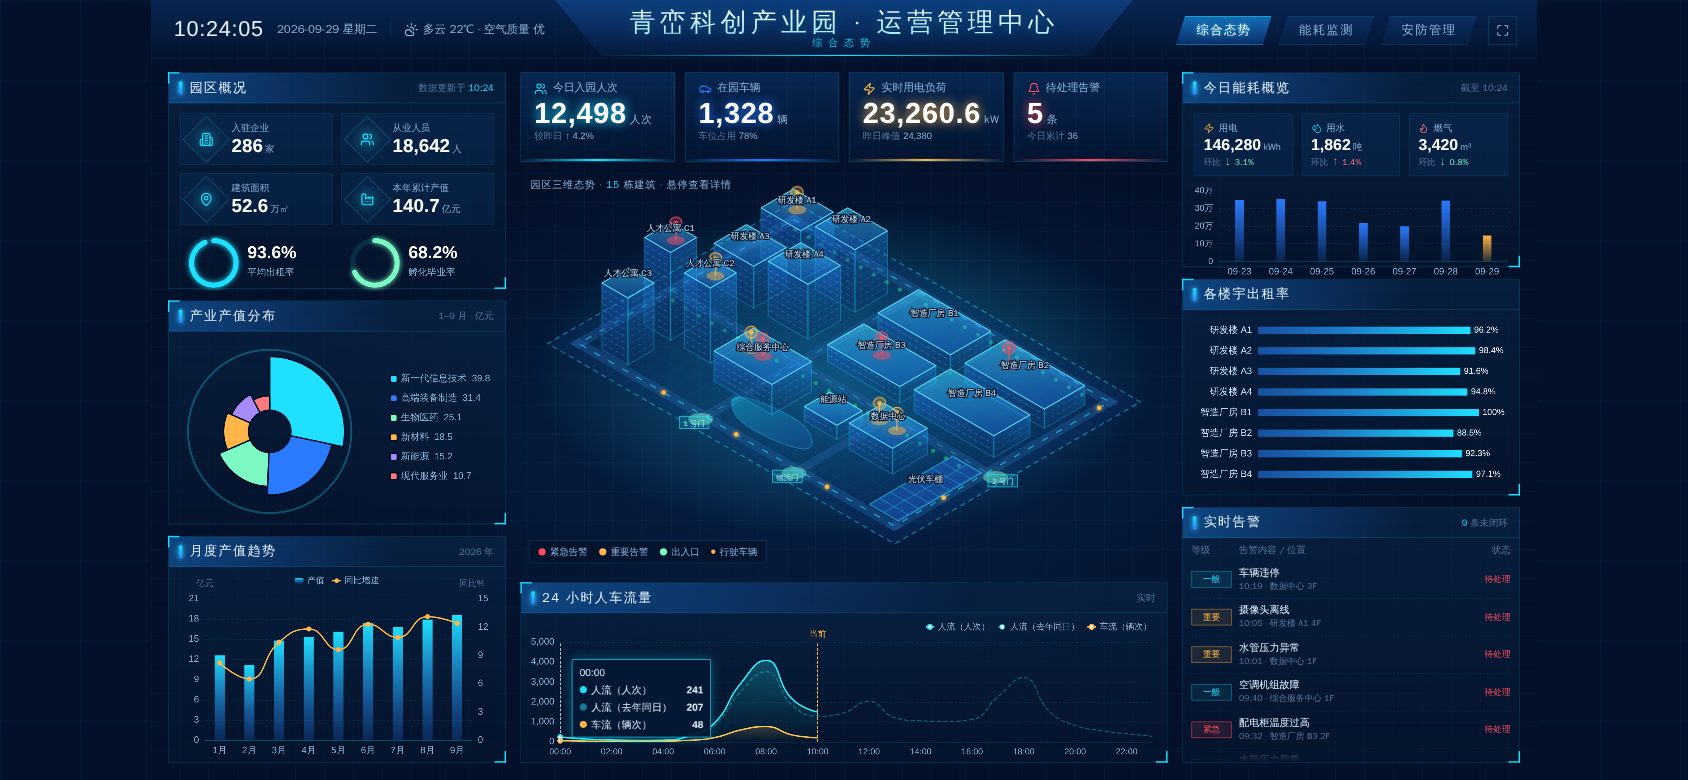
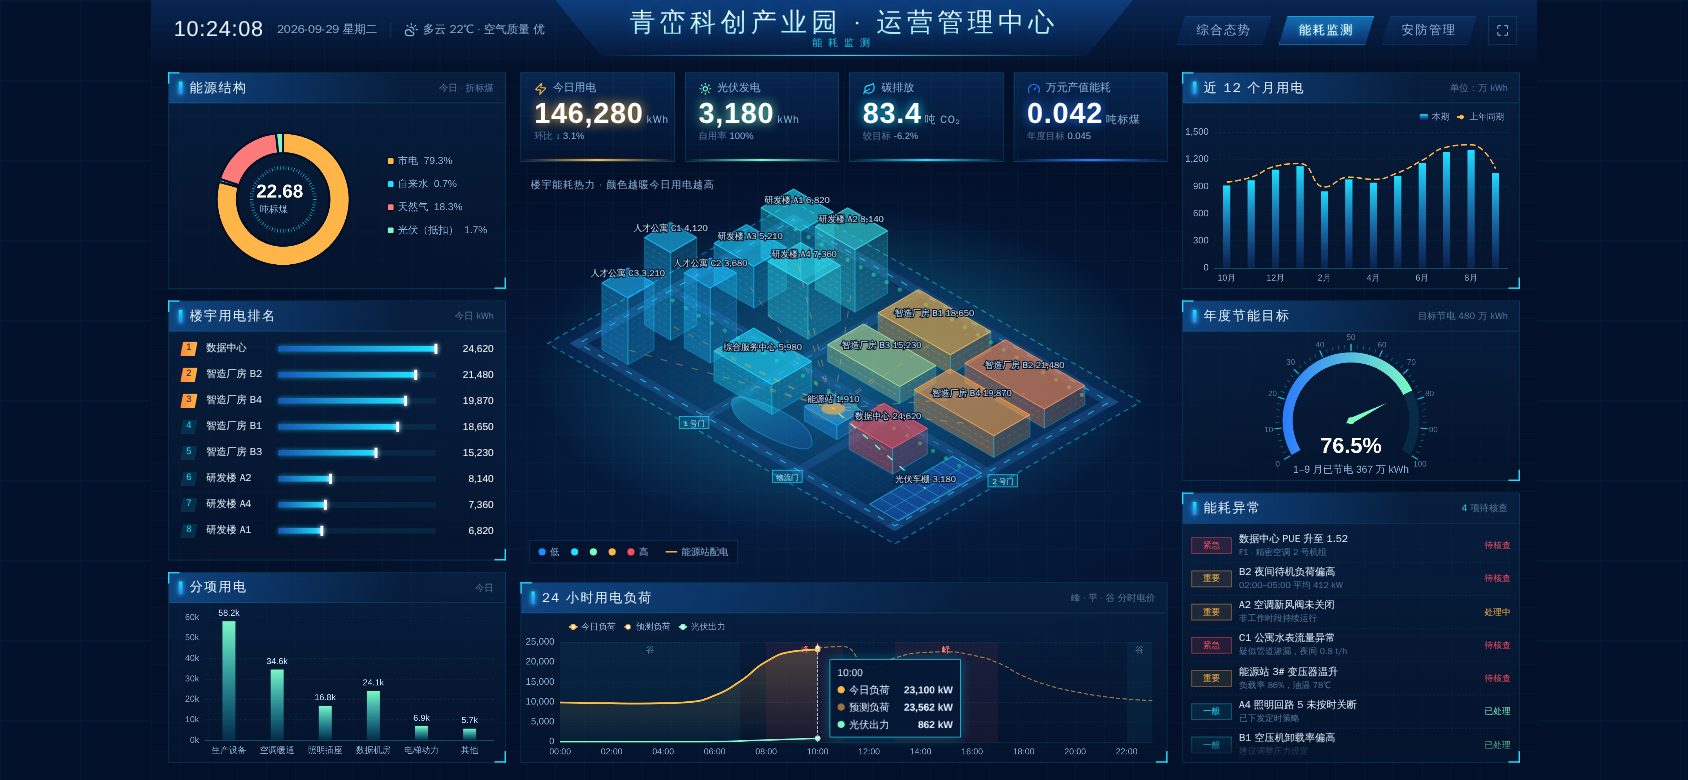
A command center big-screen dashboard for operators of industrial parks, science and technology parks, logistics parks and similar sites. It brings tenant leasing, energy use, security, and people and vehicle traffic data onto one screen. The demo shows a 3D isometric park map, live alerts linked to response actions, energy heat maps and time-of-day load analysis, and security monitoring and patrols.
Features
Design and technical highlights
- Designed at 1920×1080, scaled to fit
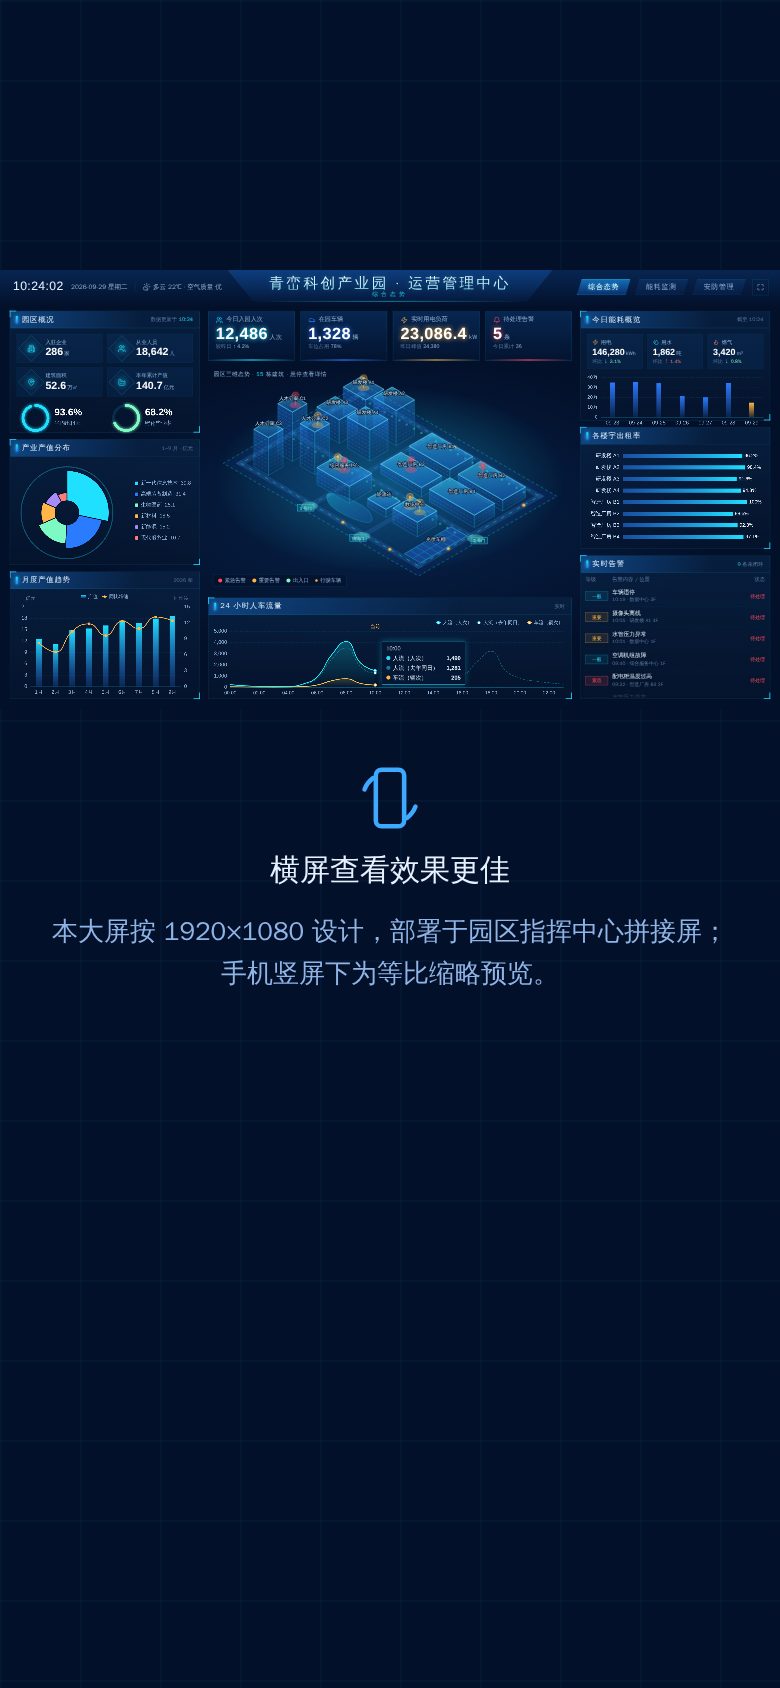
Designed at a standard control-room resolution and scaled proportionally and centered in any window, so the layout holds on both video walls and regular monitors. On a phone in portrait mode, a thumbnail is shown at the top with a prompt to rotate to landscape.
- SVG isometric park map
A 3D park drawn entirely in vector graphics: buildings are layered by depth, alert points pulse, and vehicles move along the ring road. Energy mode colors buildings by power use; security mode shows camera coverage and patrol routes.
- Alerts that can be handled and closed
The alert list scrolls automatically and pauses on hover. New alerts are inserted and highlighted in real time. Click a map point or list item to view the linked camera feed, assign the alert and confirm it is resolved.
- Animated numbers and charts
Key figures count up, chart tooltips rotate, and peak and off-peak electricity rate periods are marked, so the screen keeps showing updates even when no one is using it.
Screenshots
Mobile layout
In portrait mode the phone shows a thumbnail and a prompt to rotate; in landscape the screen fills at its original aspect ratio, swipe left or right to view.
Tell us about your business. Based on this demo, we will suggest a solution and give you a quote range.